In February, researchers published the results of an unusual experiment at TADI, a test site TotalEnergies operates near Pau, in the south of France. The operators opened valves and released known, controlled quantities of methane. Eight commercial measurement systems watched: four drone-based, three ground-based, one satellite. None of them were told how much gas was being released, or from where. That was the point.
The results, published in Atmospheric Measurement Techniques, are worth sitting with. Detection worked well: the systems caught more than 80% of the releases they were positioned to see, with false alarm rates between 0% and 11%. The participants did know the release start and stop times, which the authors note flatters detection somewhat. Still: the instruments can find a leak.
Finding a leak and sizing one are different problems, though, and the systems were good at only the first. Figure 1 sets the two questions side by side.
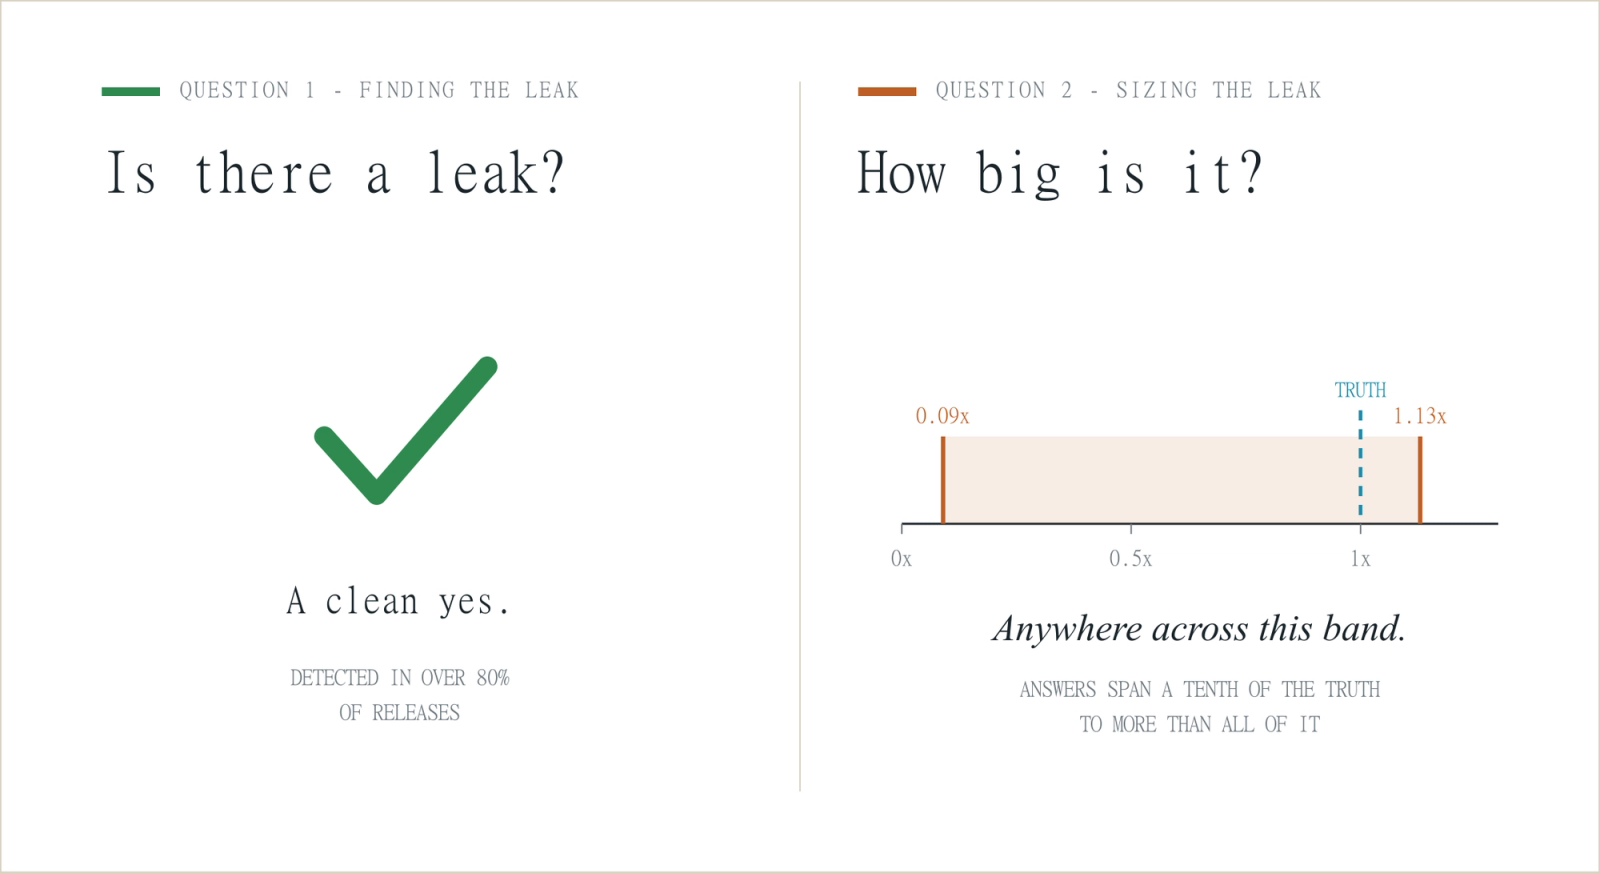
The numbers they attached to those leaks are another matter. The study fits, for each system, the slope between reported and true release rates across the campaign. Those slopes ranged from 0.09 to 1.13: at one end a system reporting, on average across its estimates, 9% of the methane actually released; at the other, 13% more than reality. Only two of the eight systems quantified releases within 50% of the true value more than half the time, and the authors caution that some systems had too few analysable releases to judge firmly. No system was within 10% of the truth in more than a fifth of its estimates. Figure 2 shows that spread in detail.
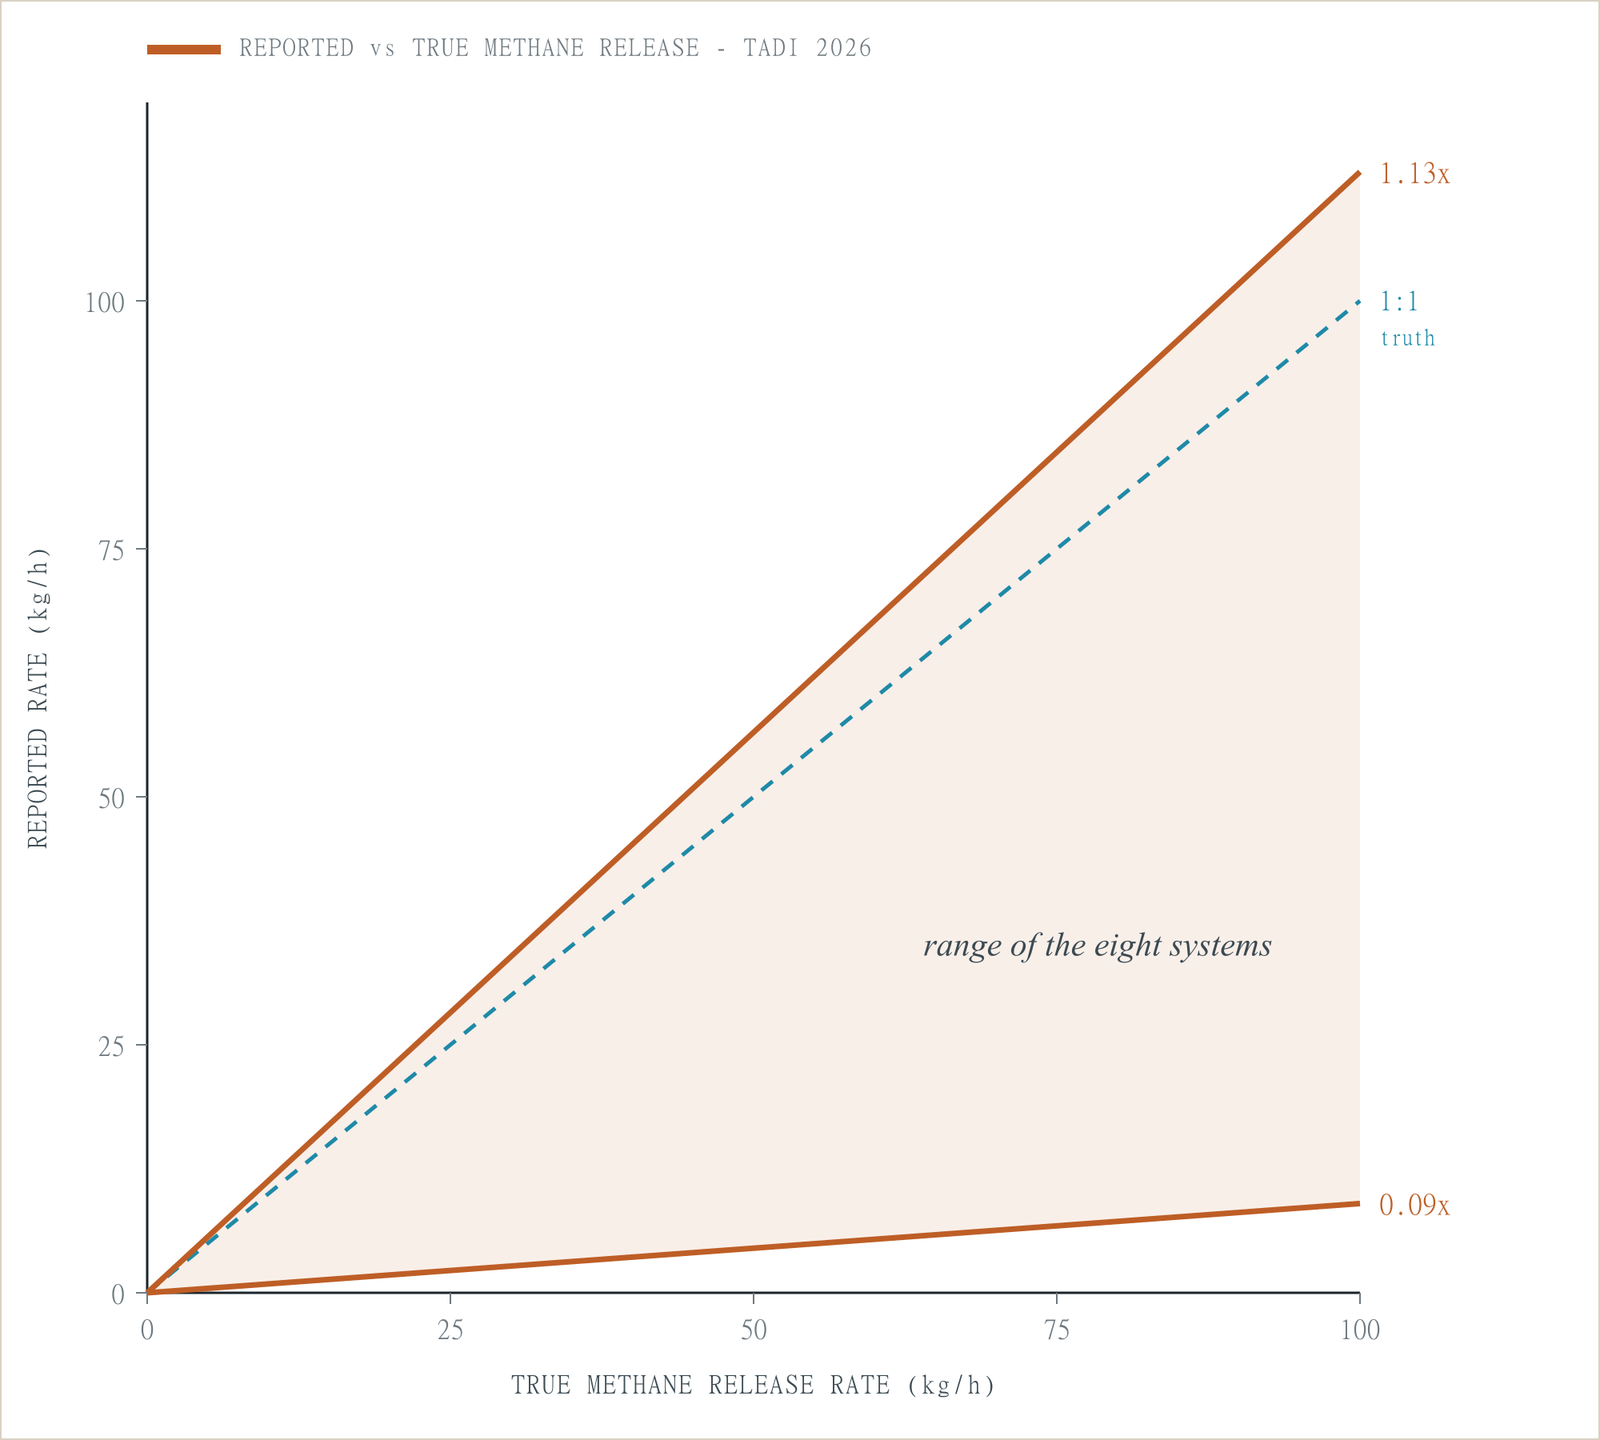
Read the dashed line as perfect agreement: a system that lands on it reports exactly what was released. The two solid lines are the gentlest and steepest response slopes across the eight systems, and the shaded wedge between them is the range a buyer is choosing from without knowing it. The eye goes straight to how wide that wedge is. The width is the whole problem.
I want to be precise about what this does and does not say. It does not say methane sensing is a failure. These are hard measurements: most of these instruments infer an emission rate from a concentration signal plus wind, and the study's authors found that wind uncertainty translates almost directly into quantification uncertainty. The vendors who participated deserve credit; submitting to a blind test is exactly what a serious instrument maker does. The paper names all eight. I am deliberately not ranking them here, because the point is structural, not commercial.
Here is the structural point. The only reason anyone now knows these performance figures is that someone built a reference: a facility where the true release rate is known because it is controlled, and a protocol where the participants cannot tune their answers to the expected result. Take the reference away and the instruments do not stop reporting. They stop being checkable. What is left is a confident number with nothing underneath it.
A measurement without a reference is not wrong. It is unverifiable. Those are different conditions, and the second is worse, because wrong can be corrected and unverifiable cannot even be caught.
Now consider who consumes these numbers when there is no blind test running. Methane emission estimates feed regulatory reporting, compliance declarations, ESG disclosures, and an increasingly heated public argument about whether reported inventories match measured reality. The buyers of those numbers, an operator choosing a monitoring contractor, a regulator checking a declaration, a journalist comparing two studies, have no controlled release to consult. They have the vendor's stated performance figures and no independent way to test them. The TADI campaign shows what the spread behind that kind of confidence can look like: an order of magnitude between the campaign-average responses of the best- and worst-case systems.
This is the part of measurement that I think the wider Earth observation conversation keeps missing. We talk about resolution, revisit rates, coverage. We rarely ask the metrologist's question: traceable to what? A controlled release is methane sensing's version of a reference standard, a known truth you can anchor an instrument against. Where such anchors are used routinely, an instrument's errors become characterised quantities you can state and defend. Where they are not, instruments can still be compared with each other, but there is no ground truth to settle who is right.
The same question runs through satellite measurement generally. Optical satellite sensors disagree about the reflectance of the same patch of ground, the basic quantity behind vegetation indices, deforestation maps, and emissions proxies, for a related reason: the references that would anchor them exist, but they are visited occasionally, as campaigns and validation exercises, rather than built into the measurement itself. The TADI study makes the same observation about methane sensing, and its authors call for rigorous, standardised testing.
It is hard to argue with that call. But a blind test once is an audit. What the numbers underneath compliance decisions need is calibration as a habit: the reference built into the measurement system, not visited by it.
Until then, when two methane numbers disagree in public, the productive question is not which team to believe. It is the one the TADI team built a field site in Pau to answer: measured against what?