Iron oxides are among the best understood materials in remote sensing. They make soil and rock red, and they absorb near-infrared light around 880 nanometres. Their spectra have sat in public libraries for decades, and Sentinel-2, the free, global workhorse of European Earth observation, carries bands in exactly the right region. Take an image, compare three bands, read off the iron. That is how a spectral index map is made, for iron or for almost anything else.
That's how lab spectrometry works, anyway. But orbital sensing has many factors getting in the way: different light sources and angles, atmospheric interference, and all kinds of surface texture effects. These can be compensated for, but that brings its own problems: correct an image as if the ground were flat, and a surface sloping away from the sun loses 20-50% of its iron signal. Being off by even a little with the water vapour measurements moves the reading more than the iron signal itself.
Iron is the first case we took on while building processing that separates a satellite reading into the factors behind it (light, air, surface texture and mineral), each with its own uncertainty. We picked it because it is widely treated as solved and routine.
A 1% dip
Sentinel-2 records three near-infrared bands, at 783, 865 and 945 nm. Draw a straight line between the outer two; the iron shows as how far the middle band falls below that line. We call that the 880 nm depth.
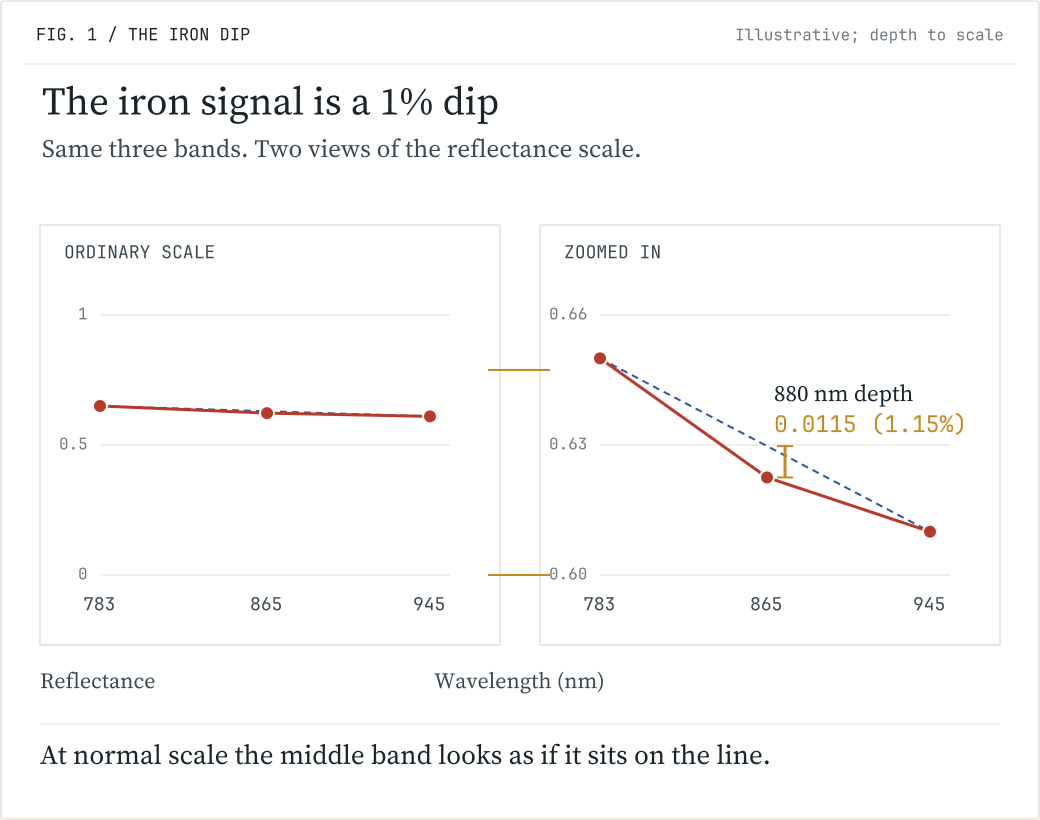
A typical red soil, built from library mineral spectra, has a depth of 0.0115: its middle band sits 1.15% under the line. Pure hematite reaches 0.186. A deeper dip means stronger iron oxide absorption, though not simply more iron, because the mineral, its grain size and what it is mixed with all change the depth.
So the whole signal for an ordinary red soil is a 1% dip in one band. Anything that moves that band by 1% moves the answer.
What moves the reading
Take a valley cut into red rock: two slopes facing each other, the same rock, holding the same iron. Read both from one Sentinel-2 image and they come back different.
The first reason is light. A tilted face receives three kinds: direct sunlight, which the tilt cuts; light scattered by the sky; and light reflected off the terrain opposite. Each has its own colour.
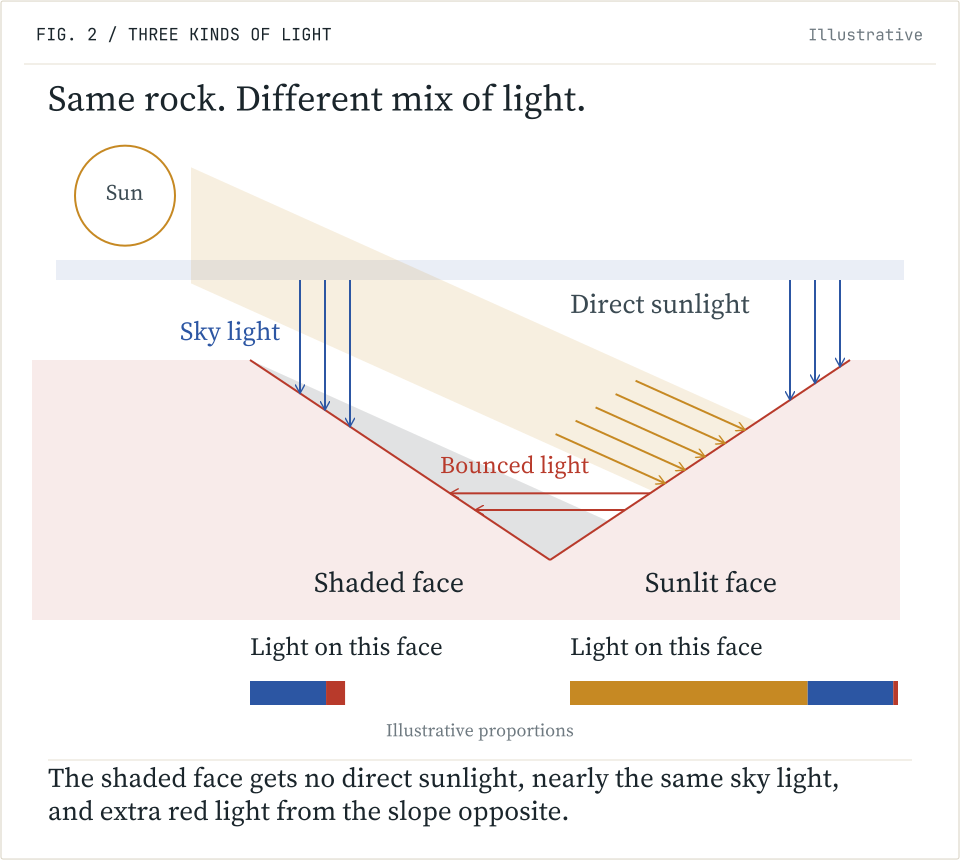
The face turned from the sun loses direct light, keeps nearly all of its sky light and picks up red light from the slope across from it. The rock is the same; the mix of wavelengths is not. Correcting satellite images for rugged terrain is a field of its own (Sandmeier and Itten, 1997), and Sentinel-2's standard processing can apply a terrain correction. What is rarely quantified is how much is left over when the signal is this small. We ran the full radiative transfer calculation, band by band: even a face that still gets half the direct light of flat ground, corrected as if it were flat, loses 20-50% of its 880 nm depth.
The second is the surface. Rough soil reflects differently at a glancing angle than face-on, and not equally at every wavelength. A laboratory study at Wageningen University tilted soil samples under a lamp and found that the 880 nm absorption changed with slope while the share of red barely did; the authors attributed the change to surface roughness (Mulder and Bartholomeus, 2009).
The third comes from the nature of multispectral measurement: each band serves particular useful purposes in sensing, and the 945 nm band, which is one of the three used to detect iron, is also what measures water vapour absorption by Sentinel-2 (Kaufman and Gao, 1992). So one of the three bands of the iron measure rises and falls with the moisture between the ground and the sensor, and haze adds a smaller error with a colour of its own.
Put them together and a single reading looks like this.
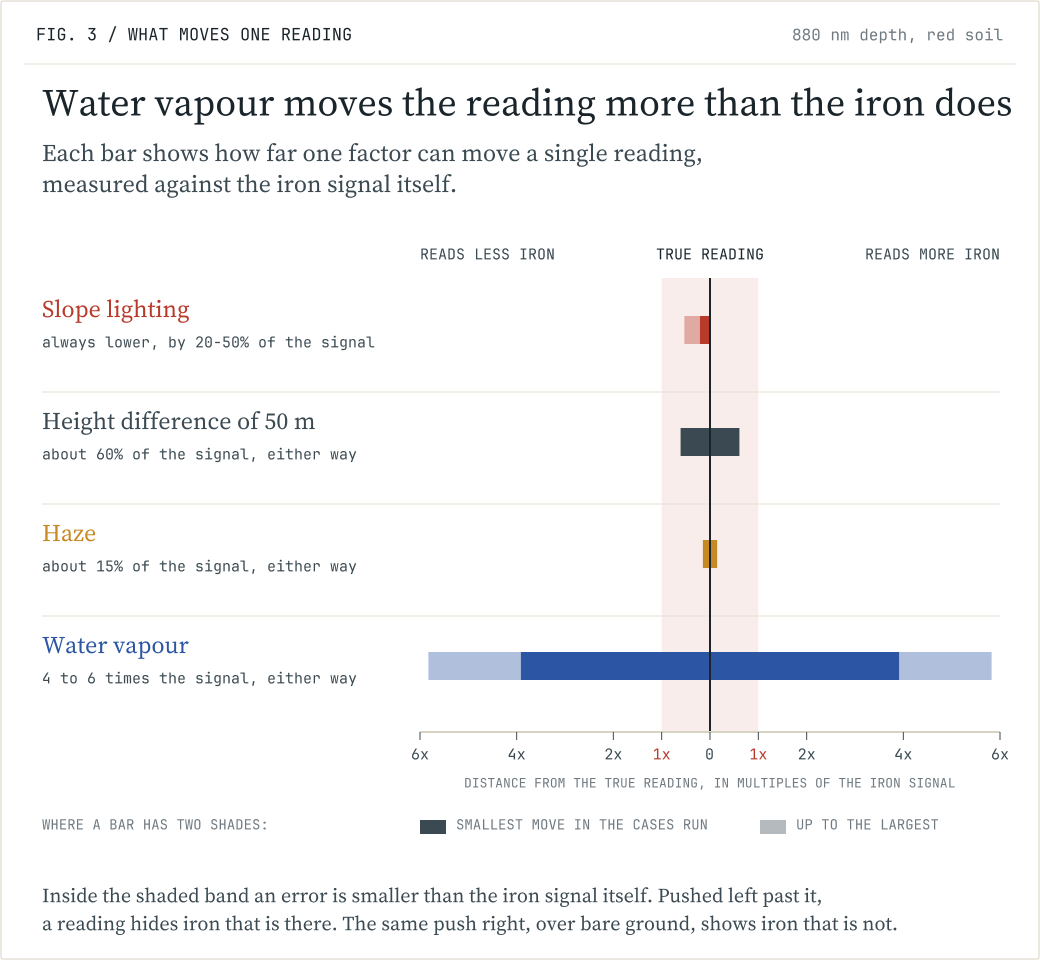
These errors do not all work the same way. Slope lighting always pushes in one direction: the face turned from the sun reads 20-50% too shallow. A 50 metre height difference between two faces, with drier air above the higher one, makes them read differently by about 60% of the red soil signal. Haze and water vapour can push the reading either way, because their exact amount over a pixel is never known. We checked a haze model against ground measurements at seven sites: the error that remains moves the reading by about 15% of the signal, up or down. Water vapour dwarfs them all. It is counted as the weight of water in the column of air above each square centimetre of ground, typically a gram or two. Checked against direct measurements at 268 ground stations, one of the best weather-model estimates is typically off by 0.18 grams (Wang et al., 2020), and an error that size moves one reading up or down by four to six times the soil signal: enough to hide iron that is there, or to show iron that is not. The iron is in there, but one reading cannot tell you how much.
Why they cannot be fixed one at a time
If these errors were separate, each could be corrected on its own. They are not.
Water vapour absorbs sky light more than direct sunlight, because scattered light travels further through moist air. So the lighting effect on a slope depends on the humidity, and intuition gets the sign wrong. Our own first estimate, reasoning from typical values, had a shaded face reading slightly deeper at 880 nm; the full calculation says shallower. The water vapour band is also one of the three bands of the iron measure, and hematite makes a simple water vapour reading come out too dry. So the water vapour correction depends on a measurement that the iron itself has already biased.
So light, air, texture and mineral arrive folded into one number, and different combinations produce the same number. A map of that number looks like a map of iron. It is a map of iron, slope, moisture and roughness, in proportions that change from pixel to pixel. A band ratio from one cloud-free scene, corrected as if the ground were flat and the air were average, gives exactly that kind of map.
Separating the factors
Two cars are painted the same grey, one flat and one metallic. In one photograph from an unlucky angle they look alike. Walk past them and the doubt is gone: the metallic paint shifts as the angle changes, the flat paint hardly at all. What a surface is made of shows in how its reflection changes.
From orbit, each factor changes in its own way when the circumstances change. Two faces in one image share the same moment and nearly the same air, so most of the water vapour drops out of the comparison between them. The same faces through the seasons, with the sun 24 degrees from overhead in June and 65 in December, separate lighting from rock. A satellite passing at another hour, such as the EMIT instrument on the International Space Station, turns the lit face into the shaded one; that is the walk past the car, and it reaches surface roughness. A water vapour reading made by a different method has a different blind spot.
No single observation settles it. They have to be analysed together: one model of how light, air, texture and mineral each affect each band, fitted to all the observations at once. The result is each factor's share of the signal, with an uncertainty on each share.
A second or third satellite adds another time of day and another viewing angle, which is exactly what we want. But it does not fix an error that comes from the processing. Sentinel-2, Sentinel-3 and Meteosat Third Generation each carry a water vapour band. We simulated water vapour retrievals from all three with the same two-band ratio: over iron-bearing ground all three are off in the same direction, their errors correlating at about 0.9. With a different retrieval method on Sentinel-3, that correlation drops to about -0.1. So the method has to vary too, not just the satellite.
All of this for iron: a strong absorption, on bare ground, under a satellite with bands built for it. A crop index, a soil moisture estimate or a burn severity map is read through the same air, under the same sun, off the same tilted and textured ground. A map read from one image will still look like an answer.
One image records what the ground reflected at one moment, under one sun and one air. What the ground is made of is read from how that changes.
Where the numbers come from
Each effect is measured and published; the sources are listed last. We computed their sizes for this measure from the inputs below. Next, we run the analysis on the first real Sentinel-2 scenes, over tilted red rock in Utah.
- Mineral spectra from the USGS Spectral Library Version 7, combined into mixtures and passed through the Sentinel-2A band responses.
- The 880 nm depth is a three-band measure. Hematite absorbs most strongly between about 850 and 900 nm, goethite from about 910 nm (Scheinost et al., 1998). Goethite's absorption reaches the 945 nm band, so the baseline sags and the depth reads goethite as weaker than it is.
- Atmosphere from stored libRadtran calculations: sun 25 and 60 degrees from overhead, haze optical depth 0.05 and 0.15 at 550 nm, water vapour 1 gram per square centimetre, ground at 1.5 km altitude.
- Slope lighting: the shaded face receives half the direct beam of flat ground and sees nine tenths of the sky, then is corrected as if flat; the depth falls by 0.0024 to 0.0061. How much of that a given terrain correction removes, band by band, is the first question for the real scenes.
- Water vapour: 0.18 grams per square centimetre is ERA5 against 268 GNSS stations (Wang et al., 2020), larger over steep terrain. Sensitivity of the depth 0.25 to 0.37 per gram per square centimetre, for columns of 1.5 down to 0.5 at 1.6 km altitude, giving 0.045 to 0.067. Higher in drier air.
- Haze: uncertainty 0.061 in optical depth at 550 nm, costing 0.0017, from our comparison of the CAMS model against AERONET ground stations at seven sites (38 readings below 0.2). A worldwide comparison finds 0.144, dominated by hazier places (Gueymard and Yang, 2020).
- The 50 metre height figure, about 0.007, is a first-order estimate.
- In Figure 3, the slope lighting and height bars are shifts a correction leaves behind; the haze and water vapour bars are one standard deviation of error in an input. None is the uncertainty budget of a product, and the water vapour range applies to the absolute level of a single reading.
- Cross-satellite comparison: simulated two-band ratios over library minerals, not the operational products, which do not all read water vapour this way. Sentinel-2 945 against 865 nm, Sentinel-3 900 against 885 nm, Meteosat Third Generation 914 against 865 nm; the differently built reading is Sentinel-3's 940 nm band against a baseline between 885 and 1020 nm. Sentinel-3 and Meteosat band responses approximated as Gaussian.
Sources
- Gueymard and Yang (2020), Atmospheric Environment 225, 117216.
- Kaufman and Gao (1992), IEEE Transactions on Geoscience and Remote Sensing 30(5), 871-884.
- Mulder and Bartholomeus (2009), Wageningen University, edepot.wur.nl/173177.
- Sandmeier and Itten (1997), IEEE Transactions on Geoscience and Remote Sensing 35(3), 708-717.
- Scheinost et al. (1998), Clays and Clay Minerals 46, 528.
- Wang, Xu, Nie and Jiang (2020), Remote Sensing 12(11), 1817.